By continuing to browse the site you are agreeing to our use of cookies. For more details about cookies and how to manage them, see our cookie policy.
Our asset base mainly consists of large scale, low cost copper mines. We are well positioned to benefit from the expected tightness in the copper market, as declining global supply coincides with continued growth in demand.
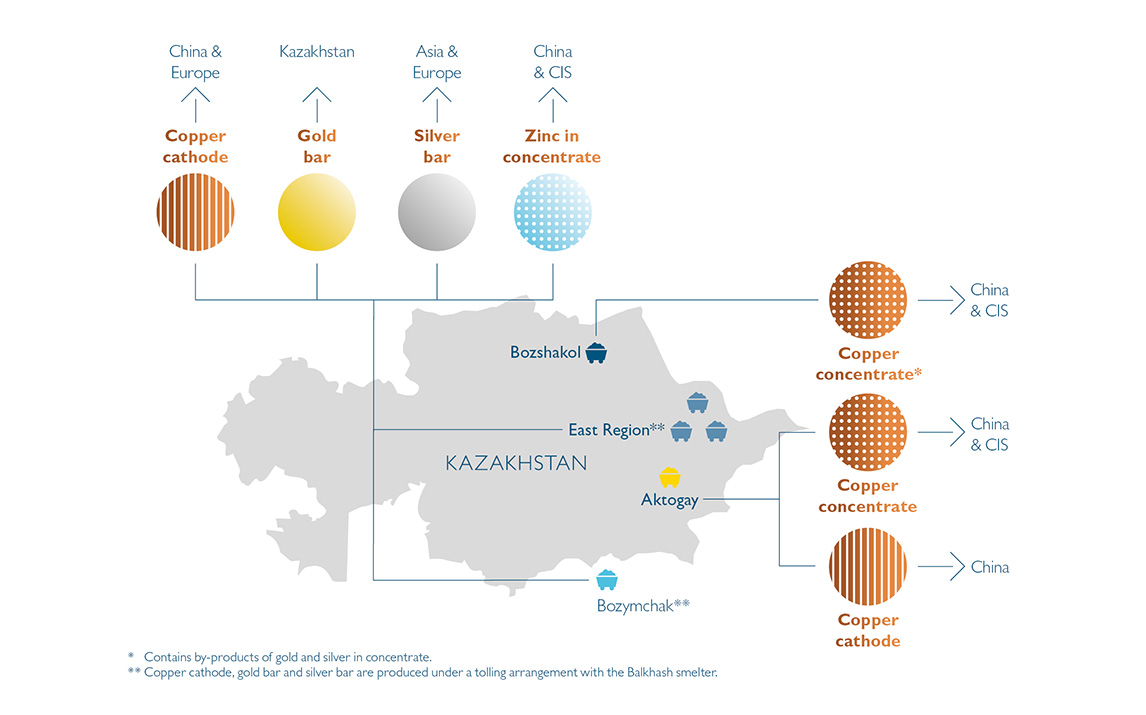
The Group’s revenues are primarily derived from the sale of copper with additional revenues from by-products of gold, silver and zinc. The Group’s performance is therefore highly impacted by commodity prices, which reflect global supply and demand fundamentals, as well as market sentiment and the activities of financial investors. Commodity prices can be volatile and cyclical, dependent upon geopolitical and macroeconomic factors, with the outlook for the Chinese economy, the biggest consumer of copper and the main physical market for the Group, of particular significance.
Copper concentrate is sold at a provisional LME copper price, less TC/RCs, which is adjusted to a final price, typically the second month after delivery. Copper cathode is sold to Chinese and European customers, with typically around 80% contracted on an annual basis and 20% sold onto spot markets. Sales are made at a provisional LME price, which is adjusted to a final price, typically one month after delivery.
Copper performed strongly during 2017, supported by a favourable macro-economic environment, stronger than expected demand from China and supply disruptions. The average LME copper price during 2017 was $6,163/t, a 27% increase compared with $4,860/t in the prior year.
An improvement in market sentiment, which began in November 2016 extended into the first quarter of 2017 as prices continued to rise due to supply disruptions, including export restrictions and labour disputes in South America. Prices resumed their upward trajectory in the second half of 2017 due to positive data and policy measures supportive of copper from China and upgrades to copper demand expectations, including widespread coverage of the potential of electric vehicles. A weaker US dollar, combined with market anticipation of possible supply disruption from labour disputes contributed to strengthening copper prices in the fourth quarter. The LME copper price ended the year at $7,157/t, 30% above the price at the end of 2016.
The copper market has remained tight, and is expected to have been broadly in balance during 2017. For the first time since 2011, global mine production is estimated to have fallen, a result of supply disruptions during the year and delays to the commissioning of new projects.
Over the next few years the copper market is expected to remain tight. Positive supply growth from new projects and brownfield expansions is expected to hit the market and broadly offset declining production from existing sources. As a result, any disruption from labour disputes or other geopolitical factors is likely to result in price volatility.
Demand is expected to maintain a moderate growth path, with China the key market. Overall consumption is expected to increase, in particular from energy grid and transport sector investment, as well as the long-term potential consumption increase from electric vehicles.
In the longer term a market deficit is expected to occur, from around 2021, driven by structural supply issues. Production growth is expected to reduce owing to declining ore grades, restricted investment, a lack of new major deposits and increased environmental, political and social risks to existing and new sources of production. With the long lead times required to bring new capacity to production, this could result in a period of consistent supply deficit and support higher long-term copper prices.
Gold and silver prices were relatively stable throughout 2017, trading in narrow ranges. Average gold and silver LBMA prices were $1,257 and $17.0 per ounce respectively in 2017, both broadly in line with the prior year. The silver market is expected to have recorded a surplus in 2017, the first time since 2012, due to weak demand factors. Prices fell to an average of $16.2 per ounce in December.
Zinc was one of the strongest performers among the base metals during the year. The average LME zinc price was $2,896/t in 2017, 38% above the average price in 2016. Prices were supported by constraints in mine supply, with falling output resulting in lower inventories and a tight physical market for both concentrate
and refined metal.
The outlook for gold and silver will be highly dependent upon macroeconomic factors. Inflationary pressures, political or economic uncertainty may benefit prices. Prices could also be supported if investor demand increases, as gold and silver are a potential source of portfolio insurance, with global stock markets currently on a long positive run.
The outlook for zinc remains positive, due to a lack of potential supply growth from new projects. Mine supply is now increasing, but not at the levels required to move the market into surplus. A continued shortage of concentrates means that treatment charges are forecast to continue to reduce.
We continually monitor commodity market and industry research. When performing business planning or assessing investment opportunities, the Group considers a range of commodity price cases and performs sensitivity analysis. The Group has cost competitive assets which can generate positive cash flow in a lower commodity price environment. The Group’s operations are also located in close proximity to the key Chinese market.
The Group is not currently and does not normally hedge commodity prices, but may enter into a hedge programme where the Board determines it is appropriate to provide greater certainty over future cash flows. In periods of lower prices the Group has successfully reduced costs and been able to defer non-critical expenditures.
The approximate effect on Gross EBITDA resulting from a 10% movement in the average realised commodity prices on the Group’s results is shown, assuming all other variables remain constant:
|
Average |
Impact of 10% |
---|---|---|
Copper sales ($/t) |
5,992 |
153 |
Gold sales ($/oz) |
1,273 |
22 |
Silver sales ($/oz) |
17 |
6 |
Zinc sales ($/t) |
2,038 |
12 |